The overwhelming majority of natural and manufactured products involve particulate materials either in their final state or at some stage in their production. Particle size and particle size distribution are, therefore, often critically important parameters.
At the simplest level, information on particle size can help maintain a more consistent product, enhancing end-use value and profitability. At a more complex level, careful control of particle size can reduce the need for in-process modifications and reworking, making your products more competitive.
• Dynamic Light Scattering (DLS)
The short-term intensity fluctuations (dynamics) of the scattered light arise from the fact that the scattering particles are undergoing rapid thermal motions. These movements are called Brownian motion and they cause short term fluctuations in the intensity of the scattered light.
Various terms have been used for this phenomenon. These are Dynamic Light Scattering (DLS), Photon Correlation Spectroscopy (PCS) and Quasi-elastic Light Scattering (QELS). To uncover the key parameters which describe the diffusive motions a digital autocorrelator is used to determine the autocorrelation function (ACF).
From these DLS measurement many interesting subjects may be explored, among them:
• Static Light Scattering (SLS)
Static Light Scattering analyses are time-averaged intensity measurements we are made at either fixed or variable angles in the range from 8° to 155° and analyzed with software provided for the methods of Zimm, Berry, Debye, Guinier, Kratky etc. Such evaluations using measured angular or concentration dependencies of the intensity of the scattered light provide key information for those interested in the such topics as:
• Sedimentation
Sedimentation analysis offers high resolution results to particle sizing where the particles are dispersed in a liquid and cover the size range from 0.01 to 30 microns. This range is useful for a variety of materials and many applications:
Typical Applications
• Diffraction
Laser diffraction analysis utilizes a diffused laser beam passing through a suspension of particles which is then scattered onto a concentric pattern of photo-detectors. A lens focuses the scattered light onto a detector array. Utilizing an inversion algorithm software calculates a particle size distribution associated with the diffraction pattern.
Typical Applications

Almost all particulate or macroscopic materials in contact with a liquid acquire an electronic charge on their surfaces. Zeta potential is an important and useful indicator of this charge which can be used to predict and control the stability of colloidal suspensions or emulsions, for example. The greater the zeta potential the more likely the suspension is to be stable because the charged particles repel one another and thus overcome the natural tendency to aggregate. The measurement of zeta potential is often the key to understanding dispersion and aggregation processes in applications as diverse as water purification, ceramic slip casting and the formulation of paints, inks and cosmetics.
Zeta potential can also be a controlling parameter in processes such as adhesion, surface coating, filtration, lubrication and corrosion. Consequently, the presence or absence of charged groups on the surface of macroscopic materials such as hair, glass fiber, paper pulp, plastic films and refractories, as revealed by their zeta potentials can directly affect their performance and processing characteristics.
Typical Applications
Analysis Options
• Single Point
Your sample is analyzed in a continuous phase of your choice; aqueous, non-aqueous, highly viscous and high ionic strengths are no problem.
• Titration
Your sample is analyzed in an aqueous phase as a function of pH, ionic strength and/or surfactant/dispersing agent concentration.
• Iso-electric point determination
We will determine where the sample's iso-electric point resides. This is where the sample is least stable in suspension and most likely to flocculate.
• Aqueous and non-aqueous media
We are capable of characterizing your samples zeta potential under almost any solution condition.
• High Ionic Strength/Viscosity
We are capable of characterizing your samples zeta potential under almost any solution condition.
Molecular weight and size are two key properties of all macromolecules including biologically important and synthetic polymers. Performance and processability are directly related to these parameters. Light scattering is capable of absolute measurements in either batch or flow mode. For distribution information, couple a GPC/SEC instrument to a light scattering detector.
Macromolecular samples often have a range of molecular weights. In some cases, this distribution is quite narrow, and in other cases, it is very broad and/or multimodal. Variations in the distribution can indicate the presence of impurities or aggregation. However, for other applications, the average molecular weight is sufficient to characterize your sample. Sometimes the distribution is of interest, and sometimes the overall average is sufficient.
• Static Light Scattering, GPC Method
Size exclusion chromatography (SEC), also known as gel permeation chromatography (GPC), uses columns to separate polymer samples. In the standard method columns are calibrated to obtain a relationship between molecular weight and elution volume. However, the column-sample interaction depends on not just the size (molecular weight) but also the chemistry of the sample. Therefore, an accurate column calibration requires standards over a range of molecular weights with exactly the same chemistry and structure (e.g., branching) as the sample. With a few exceptions, such standards are difficult or impossible to obtain, especially for new or unique materials.
Utilizing a light scattering detector in line with the GPC system provides a method of determining absolute molecular weights without resorting to any assumptions about the sample or column calibration. In this configuration the column is then simply used to separate the species of interest and the light scattering detector gives full information on the molecular weight of each fraction.
• Static Light Scattering, Batch Method
The average molecular weight of a sample may be characterized utilizing batch mode techniques to easily determine the samples properties. Batch mode analyses permit determination of the intensity average molecular weight, Mw, the z-average radius of gyration, Rg, and the second viral coefficient, A2. Data may be presented in the Zimm, Berry, or Debye plots formats to calculate these parameters.
Molecular weights in batch mode analyses are conducted by preparing dilute sample solutions of known concentrations.
General Info
In batch mode, the specific refractive index increment, dn/dc, is determined. This value is a required parameter in molecular weight measurements utilizing static light scattering techniques. Once the dn/dc is determined the value is then used to determine sample concentration for GPC/SEC applications.
Back to Top
Introduction
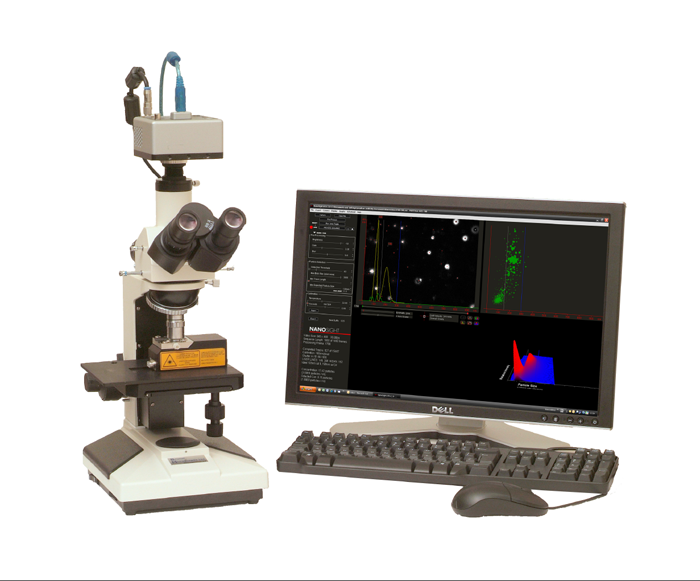
NanoSight have developed a unique instrument which can image the light scattered from nanoparticles in liquid suspension. Particles in liquid suspension move under Brownian Motion, the speed of which can be used to calculate particle size through the application of the Stokes
Einstein equation. Particle size is calculated on a particle-by particle basis which overcomes some of the inherent weakness in standard light scatter techniques which produce an average particle size weighted towards any larger or contaminant particles within a sample.
(NTA) is accomplished using the NanoSight LM10-HS instrument.
Specification |
|
Lower Limit of Detection |
10 nm |
Upper Limit of Detection |
2000 nm |
Sample Volume |
350 μl |
Laser Output |
60 mW at 405 nm (Class 1 Laser Product) |
Key Features
Experimentation:
NTA does not use the intensity of light scattered as a measure and hence there is no requirement for knowledge of the solvent refractive index of the solvent in the calculation. The software does however log and display relative particle intensities despite the absolute intensity not being used in the size calculation. As particles with higher refractive indices scatter more light, Dynamic Light Scattering (DLS) particle size distributions are weighted towards distributions that are more brightly scattering particles (whether they be larger or more refractive particles).
Application
The LM10-HS is proven with most nanoparticle classes down to 10 nm (dependent upon particle type) dispersed in a wide range of solvents:
• Size range: 10 - 2000 nm
• Any particle type
• Sample volume 350 μl
• Any solvent
• Refractive index is not required